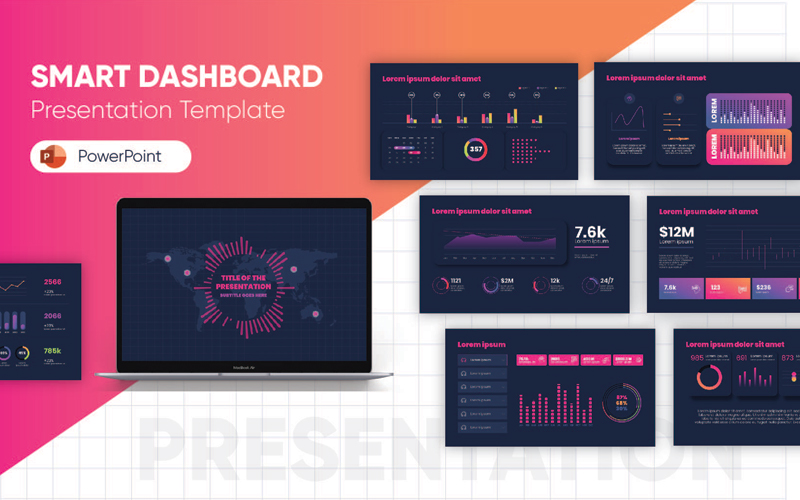
Smart Dashboard PowerPoint template


Inspiration
Numbers tell a lot when displayed accurately, different visualizations offer contrasting results when displayed between axes. While presenting the findings and doing data analysis various visualization techniques are deployed to make your audience observe that representation from multiple perspectives. We are inspired to offer versatile dashboard options so that interpretation of the data could be made simpler and interesting.
Product Description
Smart Dashboard 2 comes with high-definition graphics which are fully editable and customizable. All types of charts, flags, maps, icons etc. come with this template to help you present your findings better. A colorful representation of data with the help of visualization tools is possible using Smart Dashboard 2.
Technical Features
- 25+ Infographics
- .PPTX file
- Easy to edit
- Subject based graphics
- Theme based colors
- Flat Soothing Colors
- Premium quality designs
- Locked Aspect Ratios for Easy Scaling
- Retina Display Friendly
- Fully-editable templates
- Multipurpose slides
- 24x7 Support Service
- Non- Animated Slides
- Modify Screen Ratio Without Loss of Quality
- Help file included
- Widescreen 16:9 template
- Mobile friendly view
- Low file size
- Vector graphics
- Change Color with a Single Click
- Easy Font Change
- Flat colors
- Works on MS Office 2016, Keynote and Google Slides
Best Suited for
Every data-driven representation could be done using this template, you may want to analyse the performance of employees, look for the success rate, or want to go for the sales analysis this template is useful for all. Presentations for education, awareness, understanding, and business proposals could also be done using this amazing presentation template.